Eight of nine Tier 1 analysts are bearish. The July bounce is real — and it is a trap. Every channel, every cycle, every data point says the rally gets given back in August. Bitcoin's bottom forms between late September and early October 2026, in the $36,000 to $60,000 range. Gold is the only asset with multi-analyst constructive consensus, but watch the OBV divergence flagged by Moonin Papa.
WuWei: Do not chase. Start scaled BTC DCA in the $50-60K zone. Accelerate below $50K. Gold at $3,800 if OBV confirms. No altcoins until BTC reclaims $66,000 on a weekly close.
Source: Forex Factory · Red folder = high impact only · Times in ET
MONDAY · JULY 14 · 2026 · BEAR MARKET WEEK 12
賭
PREDICTION MARKETS · POLYMARKET
Real-money probabilities. Where the crowd is betting — and where they might be wrong.
MARKET
YES
VOLUME
CONTRARIAN?
BTC PRICE 2026
BTC to $95K by Dec 31
12.5%
$58K
—
BTC to $85K by Dec 31
21.0%
$74K
—
BTC to $80K by Dec 31
29.0%
$80K
⚠ Market MORE bearish than analysts
CRYPTO VS GOLD
BTC outperforms Gold in 2026
26.0%
$425K
✅ Confirms gold thesis (74% for gold)
MACRO
US recession by end of 2026
10.5%
$1.7M
🔥 Analysts see deep BTC bottom; market says NO recession
US economy: soft landing
44.5%
$15K
—
US economy: overheating
34.0%
$18K
—
US economy: stagflation
12.5%
$2K
—
GEOPOLITICAL RISK
Iran loses Kharg Island by Aug 31
6.3%
$1.2M
🔥 Iran risk NOT priced — digest flags as key risk
Netanyahu out by end of 2026
35.5%
$1.9M
—
Source: Polymarket · Probabilities reflect real money at stake · 🔥 = contrarian divergence from analyst consensus
鳥
X DIGEST · TIER 1 HANDLES
10 accounts · 1 x_search call · SuperGrok. Latest signals from the timeline.
ANALYST
LATEST SIGNAL
TONE
NOTE
⏳ TIME CYCLES
Mr. Abundance
ETH Jul 13 pivot played out. Next: Late Aug 2026.
⚡ Cycle
Called Jul 13 low 5 days in advance. Highest signal.
📉 MACRO & CYCLES
Camel Finance
"Base case looking good." Yield curves + inflation deep dive.
⚡ Cycle
Weekend deep dive — macro signals pointing.
Benjamin Cowen
"BTC is just a less volatile 2018"
🐻 Bear
Downtrend analog. No bottom call yet.
Jason Pizzino
18yr cycle peak. All assets falling. Brutal bottom beginning.
🐻 Bear
BTC low 2H 2026. S&P, gold, silver all in sync.
📊 TECHNICAL
Moonin Papa
BTC below cloud but higher low. Bounce to 61,584 expected this week.
⚠️ Chop
Aug-Oct still allows 38,555. ETH stronger than BTC.
Kaleo
High $30Ks/low $40Ks by late Aug/early Sep. Buy fear for 2027 ATHs.
🐻 Short
~900 days post-halving. Aligns with all bear timelines.
MegaWhale Crypto
"BTC preparing for another major crash"
🐻 Bear
Resistance warning. Levels + data video.
IncomeSharks
ETH rejected at diagonal. Avoiding crypto, favoring stocks.
🐻 Bear
Trader called "Sharks" waiting on sidelines.
Crypto Crew U
"Market rewards adaptability, not stubbornness."
⚠️ Cautious
Monthly 21 SMA key. No buy signal.
CONSENSUS
8 of 10 bearish or cautious. Mr. Abundance + Camel = Late Aug pivot. Everyone else = Sep-Oct bottom. Time cycles and macro converging on the same window. CONSENSUS: 🐻
Source: X (Twitter) via SuperGrok x_search · Jul 13-14, 2026 · Cost: 0 calls remaining this turn, 1 used
🖼
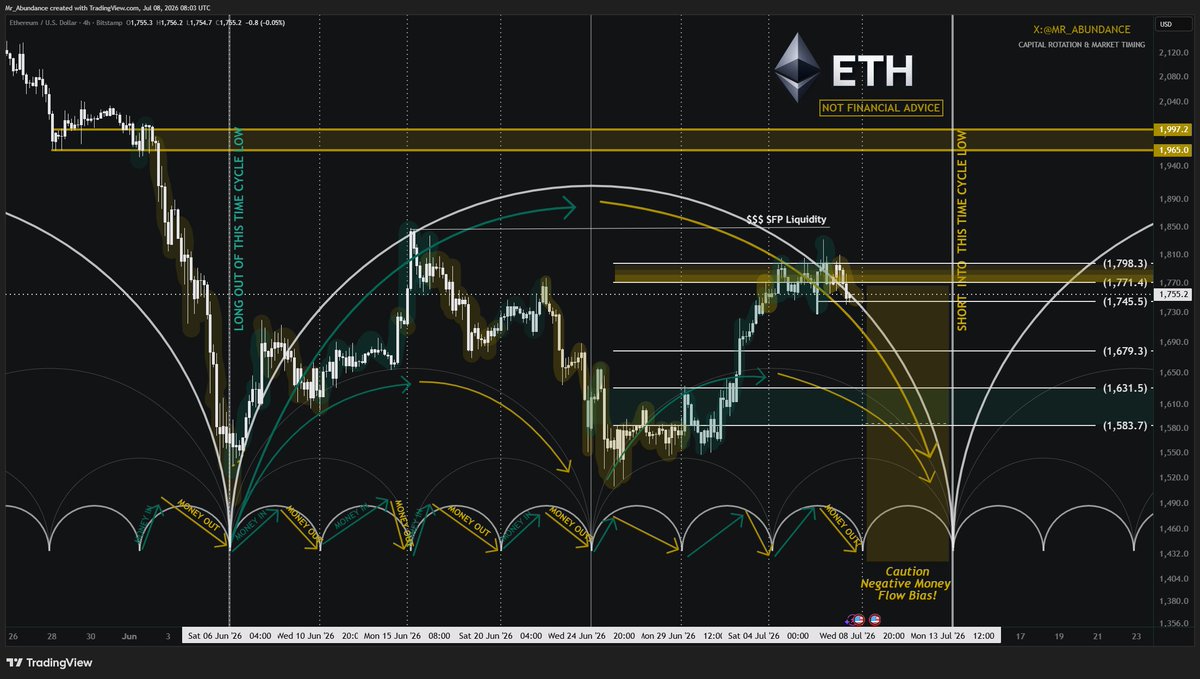
TIME CYCLES CHART · MR. ABUNDANCE
Jul 8, 2026 · ETH · Called 13th July Time Cycle Low 5 days in advance ✅
$ETH Price correcting into 8 July Sub-cycle.✅
More important is 13th July Time Cycle Low Due!
Have you seen anyone illustrate #timecycles clearer than this?
— Abundance | Capital Rotation (@mr_abundance_)
July 8, 2026
121 KB · Self-hosted · Source: @mr_abundance_
⚡ VISION ANALYSIS
ETH price chart with colored cycle bands (green/red/orange) overlaying candlestick action. Price correcting downward into the 8 July sub-cycle zone. 13th July Time Cycle Low projected as the next major pivot — marked by the lowest band. The cycle bands curve with time, widening then contracting, indicating the low-pressure zone where reversals historically form. Downtrend channel intact; cycles forecast the low BEFORE price reaches it.
Analyzed by deepseek-v4-pro native vision · $0.00
🔧 PIPELINE: x_search → post ID → browser_get_images → curl download (121KB) → vision_analyze → oEmbed HTML → deploy 💰 COST: 0.5% SuperGrok + 1 browser call + $0.00 API · Image cached locally · Embed loads from X CDN
WEEKLY CLOSE LINE-IN-SAND$66,000COWEN · PIZZINO · MEGAWHALE
CURRENT SUPPORT$61,300MOONIN · COWEN
FIRST DOWNSIDE TARGET$50-52KMEGAWHALE · MOONIN
Q3/Q4 LOW ZONE$40-60KPIZZINO
RSI MIDLINE FINAL$38,555MOONIN PAPA
GORSIAN + RSI CONVERGENCE$36,000MEGAWHALE
析
CHANNEL ANALYSIS
BENJAMIN COWEN
1M SUBS · 2 VIDEOS
BEAR
UNDERSTANDING THIS BITCOIN BEAR MARKET16m · 5.3K views
KEY PRICE LEVELS
BTC at approximately $62-64K at time of recording. Bear market resistance band (20W SMA / 21W EMA) is the critical ceiling — BTC expected to rally to it late July before rejection. Feb low was the first structural floor; that level is now being swept.
MOMENTUM INDICATORS
None specific. Cowen uses structural analogs, not RSI/MACD.
MOVING AVERAGES
Bear market resistance band: 20-week SMA and 21-week EMA. Every rally in a bear market fails at this band unless the bear market is over — and the bear market is not over.
MULTIPLE TIME FRAMES
Weekly structure for the bear market analog. Daily for the short-term rally/dump sequence. Mentions the fractal is playing out across multiple scales.
SENTIMENT
Short-term: Bearish. Two green weeks into CPI, rally to bear band late July, then August dump. Mid-term: Bottom late September to early October. Long-term: Four-year cycle intact. 2026 = 2018 structurally, 2019 from a business cycle perspective. Rotation will come when macro supports it.
TIME CYCLES
2018 structural analog (lower volatility, identical beat sequence). 2019 business cycle analog (digestion, not capitulation). Fractal breaks earlier than 2018 — bottom late Sep / early Oct, not December. 2025 top was October; proportional timeline shifts bottom forward. Midterm year cycle intact.
MACRO THESIS
Time-based capitulation cannot be sped up. The four-year cycle is not broken — rotation simply didn't happen because macro didn't support it. Both the 2018 structure and 2019 digestion can coexist as overlapping lenses on the same market. Weak hands exit through boredom, not panic.
BULLISH THESIS
Four-year cycle is not dead. Bottom is weeks away, not months. Fractal breaks earlier than most expect — consensus may be looking too far out (December) when September-October is more likely. Once the bottom is in, the rotation into alts begins.
BEARISH THESIS
Alts will bleed against BTC through August-October regardless of BTC price. 2018 replay: BTC held $6K while altcoins bled to new lows. Expect the same distribution of pain. If the structural analog extends, the bottom could be deeper than anticipated. Exogenous crash catalyst could accelerate timeline.
MOMENTUM SHIFTS
Lower high confirmed in May. Sweeping the Feb low now — this is the final structural beat before the bottom. The July rally to the bear band will look convincing but is a trap.
SENTIMENT SHIFTS
Current: hope returning on two green weeks. Expected: despair when the August dump hits. This emotional arc is part of the cycle — the bottom forms when everyone gives up.
CONTRARIAN VIEWS
Fractal breaks earlier than 2018, not later — most analysts expect December but Cowen argues September-October. The 4-year cycle is not broken, it just didn't rotate because macro didn't allow it. Rotation is not dead, it is delayed.
SEASONALITY
Two green weeks into CPI week (mid-July). Historically, July rallies in bear markets get sold in August. September-October is the seasonal bottom window for Bitcoin bear markets.
GOLD PATH FOR 202613m · 42K views
KEY PRICE LEVELS
Gold at approximately $4,000. Down 7-8% from yearly open. Bull market support band: $3,824-3,841 (20-month SMA / 21-month EMA) — hasn't been tagged since 2023. Prior midterm year drawdowns: 10-11% in 2018 and 2022. Current drop: 28% vs 2006's 26%.
MOMENTUM INDICATORS
Death cross: 50-day MA crossed below 200-day MA recently. Historically, gold death crosses precede short-term counter-trend rallies.
MOVING AVERAGES
50-day MA: Gold hasn't touched it since May — served as resistance in prior cycles. 200-day MA: crossed below by 50-day. 20-month SMA / 21-month EMA: bull market support band at $3,824-3,841.
MULTIPLE TIME FRAMES
Daily: 50-D / 200-D death cross. Monthly: 20-M SMA / 21-M EMA support band. Long-term secular trend on annual scale — 10-15+ year bull market akin to 1970s and 2000s.
SENTIMENT
Short-term: Cautious. Low likely between July and October 2026. Mid-term: Constructive. Rally into late 2026 and especially 2027 after correction resolves. Long-term: Strongly bullish. Decade-long secular bull market, midterm years are consolidation pauses.
TIME CYCLES
Midterm election year cycle is the core framework (data back to late 1960s). Average midterm bottom: early July. Prior midterms: 2018 bottomed Sep/Oct, 2022 bottomed Sep/Oct, 2014 bottomed November, 2010 rallied after late July, 2006 bottomed late June. Decade cycle: initial move early decade → consolidation ~2022 → second consolidation ~2026 → final leg to early 2030s.
MACRO THESIS
Gold follows the midterm year cycle: corrections are structural and seasonal, not terminal. Gold recovers from crises much faster than equities — 2008 gold ATH by 2009, S&P took until 2013. 2025 tariff tantrum: gold barely dropped. Gold's crisis resilience is the macro edge.
BULLISH THESIS
Gold tracking midterm year template; down only 7-8% vs 10-11% in 2018/2022 — may not go much lower. Death cross historically leads to short-term rallies (2022 example). Bull market support band hasn't been tagged since 2023 — deep support below. Midterm average bottom is early July — bottom could already be near. Gold recovered to ATHs by 2009 vs S&P until 2013.
BEARISH THESIS
Only 7-8% down vs 10-11% in prior midterms — room for more downside. 2018 and 2022 didn't bottom until September/October. S&P 500 rallying against gold recently — relative strength favoring equities. Current drop ~28% vs 2006's ~26%. If the secular bull market thesis is wrong, the entire recovery thesis fails.
SWING TRADE OPPORTUNITIES
Accumulate gold on weakness between July-October 2026 for the rally into 2027. No specific entry levels or stop-losses — implied zone between current price and the $3,800 support band.
MOMENTUM SHIFTS
Death cross triggered — bearish signal, but historically contrarian. Gold hasn't touched 50-D MA since May. S&P has "rallied against gold recently" — relative momentum favors equities near-term.
SENTIMENT SHIFTS
Gold has been "struggling" while stocks "doing okay." Tariff tantrum 2025 was the last fear spike — gold held firm. Overall tone: cautiously bullish with transparent hedging ("I could be wrong").
CONTRARIAN VIEWS
Death cross is conventionally bearish but Cowen argues it often produces short-term rallies in gold. Gold looks weak vs S&P now but historically recovers much faster from crises. Even if the secular bull thesis is wrong, a multi-month rally bounce would still occur, luring bulls before potential breakdown.
SEASONALITY
Midterm year gold bottoms June-October, with average in early July. 2026 YTD tracking closely with 2018 and 2022 seasonal patterns. Stock market seasonality (separate): shallow correction June → rally July → larger drop Aug/Sep.
JASON PIZZINO
361K SUBS · 2 VIDEOS
BEAR
BITCOIN: THE BRUTAL BOTTOM IS BEGINNING25m · 21.5K views
KEY PRICE LEVELS
$66-67K: first resistance. $70-71K: 50% retracement — the pivotal level. $40-60K: Q3/Q4 low zone for accumulation.
MOMENTUM INDICATORS
Exchange volume ~$24B: at cycle lows. Search volume index 26: approaching prior cycle lows of 23-24. Volume must return on the next breakout or the rally fails. No RSI or MACD values given — Pizzino uses volume and search data.
MULTIPLE TIME FRAMES
Daily for price action. Cycle scale for sentiment phase analysis (anger → depression → bottom). Midterm year template for the overall arc.
SENTIMENT
Short-term: Bearish. No bottom confirmation yet. Mid-term: October final low via midterm template. Long-term: Uncertain. Pizzino questions whether BTC hits a new ATH in this 4-year cycle if liquidity keeps drying up.
TIME CYCLES
June low → July/August rally → correction → October final low. This is the midterm year template. Sentiment phase progression: anger (current) → depression (not yet reached) → bottom.
Liquidity is drying up across crypto — search volume, credit flows, and general interest all declining. This is structural, not just price action. Same topping structure that produced ETH/SOL/XRP failures this cycle.
BULLISH THESIS
October low could set up a Q4 rally template (2010 example). Midterm year Q4 historically can bottom and run into the following year. A significant bounce off the Q3 low is expected even in the bear case.
BEARISH THESIS
Volume is dead. Search interest is dying. Sentiment hasn't reached depression yet — more pain needed. No confirmation that the bottom is in. Rates rising adds pressure. Liquidity is the fuel and it is absent.
SWING TRADE OPPORTUNITIES
Accumulate BTC in the $40-60K zone during Q3/Q4 for the expected breakout rally. No specific entry — the zone is the signal.
MOMENTUM SHIFTS
Volume collapsed at the last top. Search volume dying — approaching cycle lows. Volume must return on the next breakout or the rally is a failed bounce.
SENTIMENT SHIFTS
Currently in the "anger" phase — people are frustrated but not yet capitulated. Depression phase (true bottom) has not been reached. "Everyone's been excited and now they're not excited. They're bored out of their minds."
CONTRARIAN VIEWS
Openly questions whether Bitcoin hits a new ATH in this 4-year cycle if liquidity keeps drying. This is the most structurally bearish take from any Tier 1 analyst today. "It's not looking great" below $112K.
SEASONALITY
Q3 summer doldrums. Midterm year pattern: 2026, 2018, 2014, 2010 all featured sideways/corrective Q3. Clearer direction emerges Q4 of midterm year or Q1 of following year.
THE 18 YEAR CYCLE PEAK: Q3 UPDATE27m · 2.2K views
KEY PRICE LEVELS
BTC: $112K must reclaim on rising volume, $40-60K low zone. S&P 500: 7,500 resistance, 7,000-7,200 test zone, 6,500 floor. Gold: $5,600 ATH to break for new cycle confirmation. Silver: $122 ATH, may have already topped. Homebuilders (ITB): failing at 50% retracement.
MOMENTUM INDICATORS
BTC volume: "absolutely died" running into the last top. Must return on next breakout. MAG7 monthly: lower high formed, diagonal breakdown, testing 50%. Homebuilders: failing at 50% — the leading engine is stalling. Quarterly deceleration: NASDAQ +28% implies Q3 ≤14% (no exception in data shown).
MULTIPLE TIME FRAMES
Monthly: MAG7 ratio, Bitcoin volume. Quarterly: deceleration pattern (≥20% quarter always followed by <50% of prior). Annual: midterm years 2010/2014/2018/2022/2026. Multi-year: 18-year real estate cycle. 12-month: gold consolidation. 6-12 month: homebuilders outlook.
SENTIMENT
Short-term (Q3): Cautious/bearish across all assets. "Boring," "brutal market." Mid-term (Q4): Cautiously constructive IF lows form. Long-term (2027+): Cyclical peak environment. Silver may have topped. Gold may have unfinished business. BTC hinges on volume returning.
TIME CYCLES
18-year US real estate cycle: at peak now. Stocks have "a little further to go." 4-year midterm: 2010/2014/2018/2022/2026 — sideways/corrective. Q3 low pattern: BTC typically finds low Q3 into Q4. Silver 4-month cycle: ATH → sell-off → 4-month lower high → consolidation or breakdown (tracking 2008).
MACRO THESIS
18-year cycle peak. Real estate at peak now. Stock market near peak with "a little further to go." Homebuilders (leading indicator) breaking down = countdown clock to final stock market peak. Crypto liquidity drying up — same structural decay that produced ETH/SOL/XRP topping patterns.
BULLISH THESIS
Stock market may have one final push to ATHs. BTC: if it forms a low in $40-60K and rallies through $112K on increasing volume, new ATHs possible (~100% move off low). Gold in "much better position" than silver to base and break higher.
BEARISH THESIS
Silver may have already topped (tracking 2008 or worse, 2011 -48%). BTC: if volume does NOT return → high probability of failed rally (like ETH/SOL). Liquidity drying up structurally. Homebuilders breaking down starts the countdown to stock peak. Gold: if it can't hold 50% retracement, comes back down.
SWING TRADE OPPORTUNITIES
S&P 500 range trade: sell near 7,500, buy near 6,500. BTC swing: accumulate $40-60K zone, target $112K+. Gold retracement bounce: 50% or 38% retracement after 4-month correction expected "basically every single time." Stock market Q4: potential exit/short-covering opportunity.
MOMENTUM SHIFTS
MAG7 momentum shifted bearish ~November 2025 — 8 months of relative weakness. BTC volume collapsed at last top. Homebuilders failing at 50% (unlike 2022 when they led). Gold 4-month correction underway. Quarterly momentum deceleration is structural.
SENTIMENT SHIFTS
Excitement → boredom. "Everyone's been excited and now they're not excited. They're bored out of their minds for three months." Recession consensus faded — homebuilders were signaling strength while everyone called recession; now the reverse.
CONTRARIAN VIEWS
Resists the doom path: "I don't want to go too much down the doom path." Gold: jury still out, contrary to silver which may have topped. Called the recession consensus wrong in 2022-23 using homebuilders as contrarian signal. Not $200 silver / not $10K gold this cycle.
SEASONALITY
Q3 summer doldrums — historically slow. Midterm years: sideways/corrective. October low is the key window for BTC bottoms. Silver 4-month cycle: ATH Q1 → sell-off → lower high bounce. Quarterly deceleration: Q3 structurally weakest after strong Q2 — no exception in data.
BTC RSI 37.6: identified as floor level. Pi RSI 4.67: extreme oversold outlier. TBO slow-line flattening: shift from downtrend to chop — matches Cowen's "digestion" thesis. TBO close shorts: bullish signals appearing across assets. TBT divergences: bearish signals on select assets.
MOVING AVERAGES
TBO slow-line is the dominant MA framework — flattening signals trend change. OBV MAs used heavily across both videos. No traditional 200W/50W/EMA levels called out.
MULTIPLE TIME FRAMES
4H: entry timing via TBO close shorts/longs and breakouts. Daily: primary analysis frame. Weekly: macro context for Gold, Nikkei, Cosby, Fetch, Pyth, ADA, Silver.
SENTIMENT
Short-term: Bullish on July — expects 19% pop to $70K. Mid-term: Bearish August-September. Long-term: Expects lower BTC ($49K, possibly $38,555). Stop-loss caution across the board.
TIME CYCLES
No explicit cycle theory beyond the July-August-September monthly cadence. Pi unlock event noted. Seasonality: July green → August red → September red.
BULLISH THESIS
July historically green — 19% pop to $70K expected. TBO close shorts across multiple timeframes suggesting near-term upside. RSI 37.6 acting as floor.
BEARISH THESIS
$49K is the target. $38,555 if that breaks. August and September historically red — the July pop gets sold. Stop-loss hunting active. TBT divergences on multiple assets.
SWING TRADE OPPORTUNITIES
Extensive alt-coin analysis with specific levels and RSI values. Dexi RSI 94.07, FTNT 91.77 — overbought signals. TBO framework generates specific entry/exit signals across 4H and daily.
CONTRARIAN VIEWS
ETH dominance bullish = bearish signal for crypto overall. Pi extreme oversold ≠ buy. Gold technically bullish despite OBV bearish. ADA "why would you buy this." FTNT/PANW "you're a fool if not taking profit" despite 91+ RSI.
SEASONALITY
July green → August red → September red. Simple three-month arc.
Gold: technically bullish price structure. TBO close shorts still firing across multiple assets suggesting near-term upside pressure.
BEARISH THESIS
Stop-loss hunting means violent reversals. OBV bearish on gold despite price. ETH dominance rising = bearish macro crypto signal. USD/JPY unsustainable — unwind risk. TBT divergences active.
CONTRARIAN VIEWS
Gold's technical bullishness is contradicted by OBV bearishness — the only analyst across all 9 channels waving a yellow flag on gold. USD/JPY at 162.43 is "unsustainable" — expect reversal.
MEGAWHALE CRYPTO
42.1K SUBS · 2 VIDEOS
BEAR
DONT BE FOOLED.. BTC IS PREPARING FOR ANOTHER MAJOR CRASH23m · 2K views
KEY PRICE LEVELS
$66K: weekly-close line-in-sand — has held through all prior corrections in this bear market. $81K: macro bull confirmation — break above prior lower high would structurally confirm bear market end. Downside targets: $52K → $48K → $42K → $38K → $36K (level by level).
MOMENTUM INDICATORS
RSI 50% drawdown and Gorsian midline 67% drawdown both converge at $36K. Bullish divergences explicitly dismissed as volatility-compression artifacts, not genuine momentum.
SENTIMENT
Firmly macro bearish across both videos. Bear market is not over. Author positions as defending the early-exit thesis against the "bear market is over" crowd.
UPCOMING NEWS
Iran war risk: 2-3 week conflict expected, Strait of Hormuz disruptions. CPI data pending. Both could accelerate the downside.
MACRO THESIS
Bear market structurally intact. $36K convergence is the true floor — multiple independent methods point there. Iran escalation adds geopolitical tail risk to an already fragile market.
BEARISH THESIS
$66K breaks → cascade begins. Level-by-level targets from $52K to $36K. Bullish divergences are fake — volatility compression, not momentum shift. Iran war 2-3 week scenario adds downside pressure.
BULLISH THESIS
If $81K breaks, the bear market is structurally over — confirmed by three prior cycles. $66K has held through all corrections so far — it is not broken yet.
CONTRARIAN VIEWS
Explicitly positioned against the "bear market is over" crowd. Defends the early-exit thesis. Dismisses bullish divergences. The deepest target ($36K) of any Tier 1 analyst.
THIS MAJOR RESISTANCE COULD CHANGE EVERYTHING20m · 5.4K views
KEY PRICE LEVELS
Same targets as Crash video: $66K line → $52K → $48K → $42K → $38K → $36K convergence. The $36K level is the deepest target from any analyst — RSI 50% and Gorsian 67% both land there.
MOMENTUM INDICATORS
Gorsian midline: proprietary indicator showing 67% drawdown target at $36K. Combined with RSI 50% drawdown — double convergence. Bullish divergences are compression artifacts, not reversal signals.
BEARISH THESIS
Structural bear market not over. $36K is where every method converges. Waiting for breakdown below $52K to confirm the deeper targets. Any bounce is a trap — the structure points lower.
BULLISH THESIS
$81K is the macro bull confirmation. Break above that = bear market over (matches all three prior cycles). Until then, the default is bearish.
CONTRARIAN VIEWS
Most analysts see a bottom in the $40-60K range. MegaWhale sees $36K. The Gorsian midline is a proprietary method not used by other Tier 1 channels — independent signal. If he's right, everyone else is early.
CRYPTO CREW UNIVERSITY
409K SUBS · 1 VIDEO
BEAR
3-MIN RECAP: BITCOIN TOO QUIET... WHY?3m · 4.5K views
KEY PRICE LEVELS
BTC at approximately $80K two months ago — implied prior support now lost. Current levels analyzed on weekly chart.
MOMENTUM INDICATORS
RSI (weekly): following bear market pattern — range 0-100 but no specific level given. Stochastic RSI (weekly): "the star of today's show" — currently stalled at approximately 20. Watching for blue and orange lines to dip below 20 = "fireworks" (sharp downside). Weekly stochastic RSI crosses typically happen twice per year.
MOVING AVERAGES
21 SMA (weekly): the "green moving average." Bitcoin spent "some time above" it. Historically, being above the 21 SMA during bear markets signals "this is going to be short-lived."
MULTIPLE TIME FRAMES
Weekly chart only. All analysis presented on the weekly — no daily, 4H, or other timeframes.
SENTIMENT
Short-term: "Breaking point" — could go either direction quickly. "Calm before the storm." Mid-term: Stochastic RSI cross down = "price will plummet" → golden zone buy opportunity. Long-term: Cyclical — "every single bear market has a repeatable pattern" → bottom → recovery.
TIME CYCLES
Stochastic RSI crosses "typically happen twice per year." "Two months ago" BTC above $80K — the speed of the breakdown implied.
BULLISH THESIS
RSI buy signal when oversold. 21 SMA above in bear market = short-lived weakness. Promotes "Bitcoin Bottom Blueprint" with golden zone buy — positioning the approaching drop as an accumulation opportunity.
BEARISH THESIS
"A storm is brewing." Stochastic RSI cross down below 20 = "price will plummet." The dip below 20 is the trigger for significant downside acceleration. BTC is at a "breaking point."
SWING TRADE OPPORTUNITIES
Rule-based RSI strategy: "Buy Bitcoin when it's oversold — sell when it's overbought" (weekly RSI). The "golden zone" buy is promoted via the Bitcoin Bottom Blueprint product — implied accumulation after the anticipated drop.
MOMENTUM SHIFTS
Stochastic RSI cross down is the primary trigger being watched — on the weekly. Currently stalled at ~20 — the dip below is the moment from "calm" to "storm."
SENTIMENT SHIFTS
Current: "Calm before the storm" — quiet, low-volatility consolidation. Expected: high volatility / "fireworks" either direction, bias toward downside via stochastic RSI cross.
SMART MONEY TRACKING
4.5K SUBS · 1 VIDEO
BEAR
GET READY: BITCOIN IS ABOUT TO BREAK!15m · 899 views
KEY PRICE LEVELS
BTC top called at $120-125K — SMC bot sell signal fired there. Waiting for SMC buy signal to go massively long. LIT short: 4H M-pattern, target 184-185.
MOMENTUM INDICATORS
SMC bot is the sole momentum/entry tool — used across 4H, daily, and weekly. No RSI, MACD, or traditional indicators. The bot generates buy/sell signals based on proprietary Smart Money Concepts methodology.
Currently SHORT crypto, LONG oil. Bearish on crypto until SMC buy signal appears. Waiting to flip "massively long" into the next bull run. 4-year cycle thesis intact — the buy signal triggers the rotation.
TIME CYCLES
4-year cycle thesis. The SMC bot has called prior cycle tops and bottoms. Waiting for the next buy signal to confirm the bottom and go long.
BULLISH THESIS
SMC buy signal will trigger a massive long entry. 4-year cycle bottom approaching. Once the signal fires, expect a significant run — author is "waiting to go massively long."
BEARISH THESIS
Currently short — the bot says more downside. No buy signal yet means the bottom is not confirmed. Top was correctly called at $120-125K, adding credibility to the current bearish stance.
SWING TRADE OPPORTUNITIES
LIT short: 4H M-pattern with 184-185 target. Oil long via the SMC bot.
CONTRARIAN VIEWS
Only source disclosing live positions. Short crypto while most retail is looking for a bottom. Long oil — an inflation/geopolitical hedge play.
歧
DISCREPANCIES
BTC BOTTOM: $36K VS $50-60K
Cowen most conservative (~$50-60K). MegaWhale deepest ($36K). MooninPapa splits ($49K, $38K final). Consensus on direction and timing — disagreement on magnitude. Deeper becomes more likely the longer we stay below $66K.
GOLD: BULLISH — WITH ONE YELLOW FLAG
Cowen all-in (most-viewed video at 42K). Pizzino cautiously agrees. But Moonin Papa flags OBV bearish divergence — the only analyst across all 9 channels tempering the gold thesis. Watch OBV as gold approaches $3,800.
SILVER MAY HAVE ALREADY TOPPED
Pizzino is the only analyst covering silver — and he is bearish. Tracking 2008 analog (breakdown → 1-2 year base) or 2011 (-48%). Do not treat silver like gold.
SMART MONEY IS POSITIONED SHORT
SmartMoney Tracking: short crypto, long oil. The only source disclosing live positions. Real money positioning confirms the analyst consensus. Waiting for SMC buy signal to flip.
WUWEI CALL · JULY 14
IMMEDIATE: Do not chase the July bounce. Every analyst, every cycle, every data point says it gets given back in August. CPI week historically red after two green weeks. Watch $66K on weekly close — below that and the $52K→$36K cascade becomes the working thesis.
ACCUMULATION WINDOW (SEP-OCT): Start scaled BTC DCA in the $50-60K zone. Accelerate below $50K. Size up below $40K. Gold if it tags the $3,800 bull support band and OBV confirms. No alts until BTC reclaims $66K.
RISK: Iran escalation could bring the bottom forward. Forced rate hikes = 2022-style liquidity shock.
The sage does not chase. The sage waits for the stone to drop and the ripples to settle.